How Poor Workplace Design Reduces Revenue
Poor workplace design can directly reduce productivity and revenue, and Riley Riley Construction documents these impacts with measurable metrics
Workplace design is not decoration; it is a business system that affects daily operations, staff morale, and customer behavior. When the physical environment is misaligned with work processes and customer flow, losses can be quantified in time, conversion rates, and ultimately revenue. Riley Riley Construction assesses those gaps with measurable metrics, translating ergonomic shortcomings, circulation bottlenecks, and sensory distractions into specific cost exposures.
Understanding how poor workplace design reduces revenue begins with observing where people stop, slow down, or make errors. A poorly lit retail aisle, cluttered reception, or acoustically harsh open office all create friction. Those frictions slow service, increase mistakes, and lower conversion. This page outlines common design failures, practical diagnostics, targeted renovations, and how to calculate the return on improvement so decision makers can prioritize changes that yield measurable financial benefits.
In environments ranging from small retail stores to corporate offices, the same design principles apply: reduce friction, support tasks, and guide behavior intentionally. Below we describe the primary mechanisms by which design affects performance, provide actionable measurement techniques, and show renovation strategies that generate a demonstrable impact on productivity and revenue.
How poor design reduces productivity and customer conversion
Poor workplace design reduces revenue through multiple, interrelated pathways. Employees who struggle with inefficient layouts or uncomfortable workstations take longer to complete tasks and make more errors. Customers who cannot find products, feel rushed, or encounter an unpleasant environment are less likely to convert. These outcomes are measurable: average transaction time, error rates, abandonment rates, and throughput per hour are all quantifiable and linked directly to design elements.
For example, a narrow checkout zone creates queues that elevate abandonment. In call centers, inadequate acoustics increase call handling time and rework. In offices, inattentive layout choices cause interruptions that fragment focus, reducing deep-work hours. When these delays aggregate across weeks or months the lost billable labor and missed sales opportunities compound into material revenue loss.
Below are common metrics that demonstrate the connection between space and financial performance:
- Average transaction time: longer times correlate with fewer transactions per hour.
- Customer dwell-to-conversion ratio: percentage of visitors who make a purchase or request service.
- Task completion time and rework rate: measurable in minutes per task and percent rework.
- Absenteeism and staff turnover: higher in poorly designed or uncomfortable environments.
- Employee satisfaction scores tied to productivity benchmarks.
| Design Issue | Typical Measurable Impact | Business Outcome |
|---|---|---|
| Poor lighting | 5%-15% slower task completion; increased errors | Lower throughput, higher return/exchange rates |
| Acoustic distraction | 10%-25% more interruptions; longer handling times | Reduced billable hours, diminished customer service scores |
| Cluttered circulation | 20%-40% customer drop in conversion in peak periods | Lost sales and poor first impressions |
Layout failures: circulation, zoning, and visual hierarchy
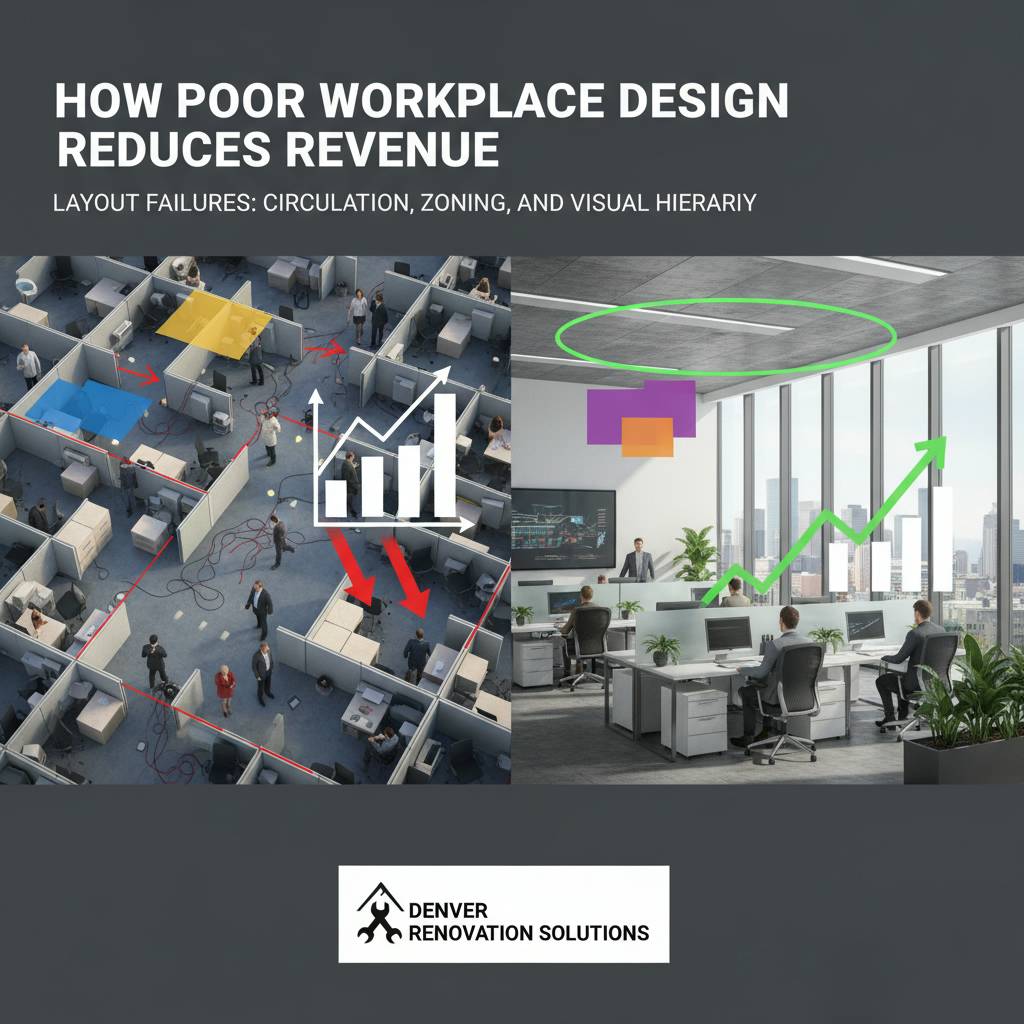 Layout governs movement and attention. An effective plan anticipates routes for staff, customers, deliveries, and safety egress while maintaining clear sightlines and zones for focused work or browsing. When circulation paths are ambiguous, people hesitate or backtrack; that hesitation translates to lost time for workers and lost conversions for customers. Design that forces cross-traffic through service areas creates interruptions and reduces efficiency.
Zoning is the deliberate grouping of activities to minimize friction. Poor zoning places incompatible tasks next to one another-phone sales near heavy machinery, or high-traffic customer areas beside quiet workstations-causing distraction and inefficiency. Proper zoning reduces movement, clarifies roles, and lets each area perform optimally without unintended interference.
Visual hierarchy and wayfinding
Visual hierarchy and signage directly affect customer behavior and employee efficiency. If a customer cannot immediately identify where to go, cognitive load increases and conversion decreases. For employees, a lack of clear visual cues means longer search times for supplies or products, which slows service. Simple interventions-consistent sightlines, contrast-based signage, and logical product grouping-reduce decision time and improve throughput.
Environmental issues: lighting, acoustics, temperature, and ergonomics
Environmental systems are often undervalued because their costs are indirect, but they have direct effects on performance. Lighting quality affects concentration and error rates; flicker, low color temperature, or poor uniformity penalize precision tasks. Acoustics shape cognitive load-excess reverberation or steady background noise elevates stress and interrupts communication. Temperature extremes degrade concentration and can increase short-term absenteeism.
Ergonomics addresses fit between people and their work tools. Repetitive strain injuries, poor posture, and inadequate equipment increase sick days and diminish sustained productivity. A properly ergonomic environment reduces small inefficiencies-like reaching for tools or adjusting chairs-that accumulate into lost minutes per task and translate into measurable labor costs over time.
Practical environmental adjustments
Addressing environmental deficits does not always require large budgets. Targeted solutions-LED lighting retrofits, localized acoustic panels, programmable thermostats, and adjustable sit-stand workstations-deliver measurable gains in alertness and error reduction. has found that even modest improvements in these areas yield clear upticks in both employee satisfaction and service consistency.
How to measure and document design-related revenue impacts
A diagnostic approach converts design observations into quantitative evidence. Start with baseline data: capture transaction counts, average handling or service time, customer conversion rate, and absenteeism over representative periods. Pair these metrics with observational logs that document where delays or interruptions occur. Video sampling, time-and-motion studies, or digital tracking (where privacy-compliant) can reveal micro-inefficiencies that are otherwise invisible.
Once baseline metrics are established, implement controlled changes and compare results. Because workplace interventions rarely occur in isolation, use A/B or phased rollouts-retrofit one area and maintain another as a control. Statistical comparisons of before-and-after data will reveal the degree to which a renovation affected throughput, errors, or conversion. This evidence supports prioritization and capital allocation for further improvements.
- Step 1: Record baseline KPIs for two to four weeks in consistent conditions.
- Step 2: Map workflow and identify friction points with observational notes.
- Step 3: Make a targeted intervention in one zone and collect the same KPIs.
- Step 4: Analyze differences and calculate revenue impact using unit economics.
For example, if average transaction time falls by 10% after an intervention and the store averages 500 transactions per week at $40 average sale, the uplift in transactions-per-hour can be translated into incremental weekly revenue using a simple formula that multiplies saved time by throughput and conversion rates. Riley Riley Construction documents these calculations in diagnostic reports so that changes are defensible and investment-grade.
Targeted renovations that drive measurable ROI
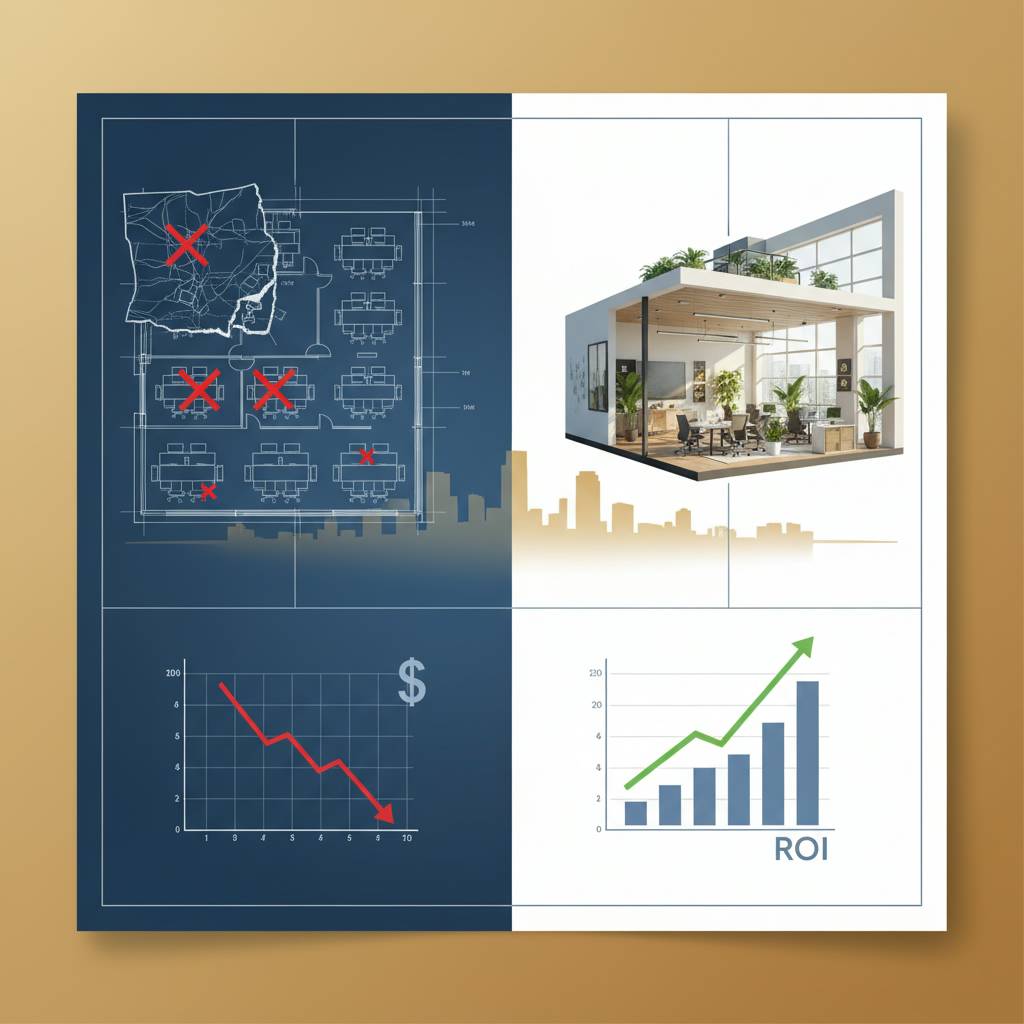 Renovations should be targeted to the highest-impact problems. Low-cost, high-return fixes often include lighting upgrades, decluttering circulation paths, installing productive signage, and improving workstation ergonomics. Medium investments-acoustic treatments, partial layout reconfiguration, or adding dedicated service counters-reduce interruptions and improve conversion more substantially, while larger capital projects, such as full-floor reconfigurations, are justified when incremental revenue gains exceed renovation costs over a reasonable payback period.
Typical cost ranges (indicative) help frame decisions: lighting fixture upgrades might run $75-$200 per fixture depending on quality and controls; ergonomic workstation refits commonly fall in the $250-$800 range per station; targeted acoustic treatment for a medium space can range $1,500-$7,500 depending on extent and materials. These costs should be weighed against documented increases in throughput, reduced downtime, and improved retention to determine clear ROI.
To prioritize projects, apply a simple scoring matrix: weigh the severity of the issue, the number of people affected, and the estimated financial impact. Multiply the likely revenue gain by probability of success to arrive at an expected value. This approach brings rigor to design decisions and helps justify budgets to stakeholders who demand measurable outcomes.
Case examples: measurable outcomes from design interventions
Case 1: A regional retailer reworked circulation and checkout clustering after Riley Riley Construction documented 18% conversion loss during peak hours due to congestion. After reconfiguring queue paths and adding visible wayfinding, average check-out time fell by 22% and conversion rose by 9% within six weeks. The revenue gain offset the modest investment in under four months.
Case 2: A professional services office addressed acoustic distractions that were increasing call durations by 15%. By installing zoned acoustic panels and reassigning quiet work zones, call handling time decreased by 12% and billable time increased measurably. Employee-reported concentration improved, and turnover rates declined in the subsequent quarter.
These examples highlight a common pattern: targeted diagnostics identify precise levers, modest renovations unlock measurable gains, and disciplined measurement validates outcomes. Riley Riley Construction packages these findings in reports that link design choices to financial results, enabling managers to pursue renovations with confidence.
Implementation roadmap and what to expect from a diagnostic assessment
An effective diagnostic balances observation, measurement, and stakeholder interviews. Typical phases include an initial walk-through, baseline KPI capture, focused observational studies, and prioritized recommendations with estimated costs and expected revenue impact. A recommended timeline for a standard diagnostic is two to six weeks, depending on business hours, volume of data and the complexity of space. The final deliverable is an actionable roadmap that connects design changes to projected improvements in productivity and revenue.
When you engage a diagnostic provider, expect clear documentation: photo and video evidence, annotated floor plans, KPI trend charts, and a prioritized action list with estimated budgets and payback calculations. This level of detail helps procurement and finance teams evaluate projects on commercial merit rather than aesthetic preference.
Follow-up is important. After interventions are implemented, a short re-audit three months later confirms performance changes and identifies further optimization opportunities. Iterative improvements, guided by data, ensure investments continue to generate returns over time.
Next steps and how Riley Riley Construction can help
If you are concerned about how poor workplace design reduces revenue in your organization, the first step is a measured diagnostic. Riley Riley Construction offers assessments that translate environmental and layout issues into measurable business impacts, with clear recommendations and estimated ROI so leadership can make evidence-based decisions. Our reports are designed for operational teams and financial approvers alike, showing where to invest for the greatest short- and long-term returns.
To request a diagnostic, schedule a site visit, or discuss a pilot reconfiguration, contact Riley Riley Construction at 17207828897. A brief initial conversation will allow us to outline the scope, timeline, and expected deliverables so you can decide with confidence. Small changes often unlock significant results, and a diagnostic will tell you which changes matter most for your bottom line.
Call to action: Request a diagnostic today and receive a concise roadmap tying design upgrades to revenue projections. Contact Riley Riley Construction at 17207828897 to arrange an assessment and begin quantifying the cost of your current design inefficiencies.
We look forward to helping you reduce friction, increase productivity, and turn design into a measurable contributor to revenue. Reach out to Riley Riley Construction at 17207828897 to get started.